Case study
Abnormal Move Prediction in S&P 500 Stocks
Will a stock make an abnormal move tomorrow? A binary classifier over 5 years of daily price and volume data for 505 S&P 500 stocks, built for CSE 5367 (Pattern Recognition) at UT Arlington.
- Test AUC (Random Forest)
- 0.723
- Test F1 at a 2% threshold
- 0.307
- Daily OHLCV rows
- 619,040
- No-lookahead features
- 12
How it works
- 1
Load
619,040 daily OHLCV rows for 505 stocks, 2013–2018
- 2
Engineer features
12 per stock-day (returns, volatility, price range, gap, true range), past data only
- 3
Label
Next-day return beyond 2% or 1.5% in either direction
- 4
Split by time
Train, validation and test in date order, no shuffling
- 5
Train and tune
Five models, hyperparameters chosen on validation F1
- 6
Evaluate
All models scored on the same held-out test period
Results
| Model | Test F1 | AUC | Precision | Recall |
|---|---|---|---|---|
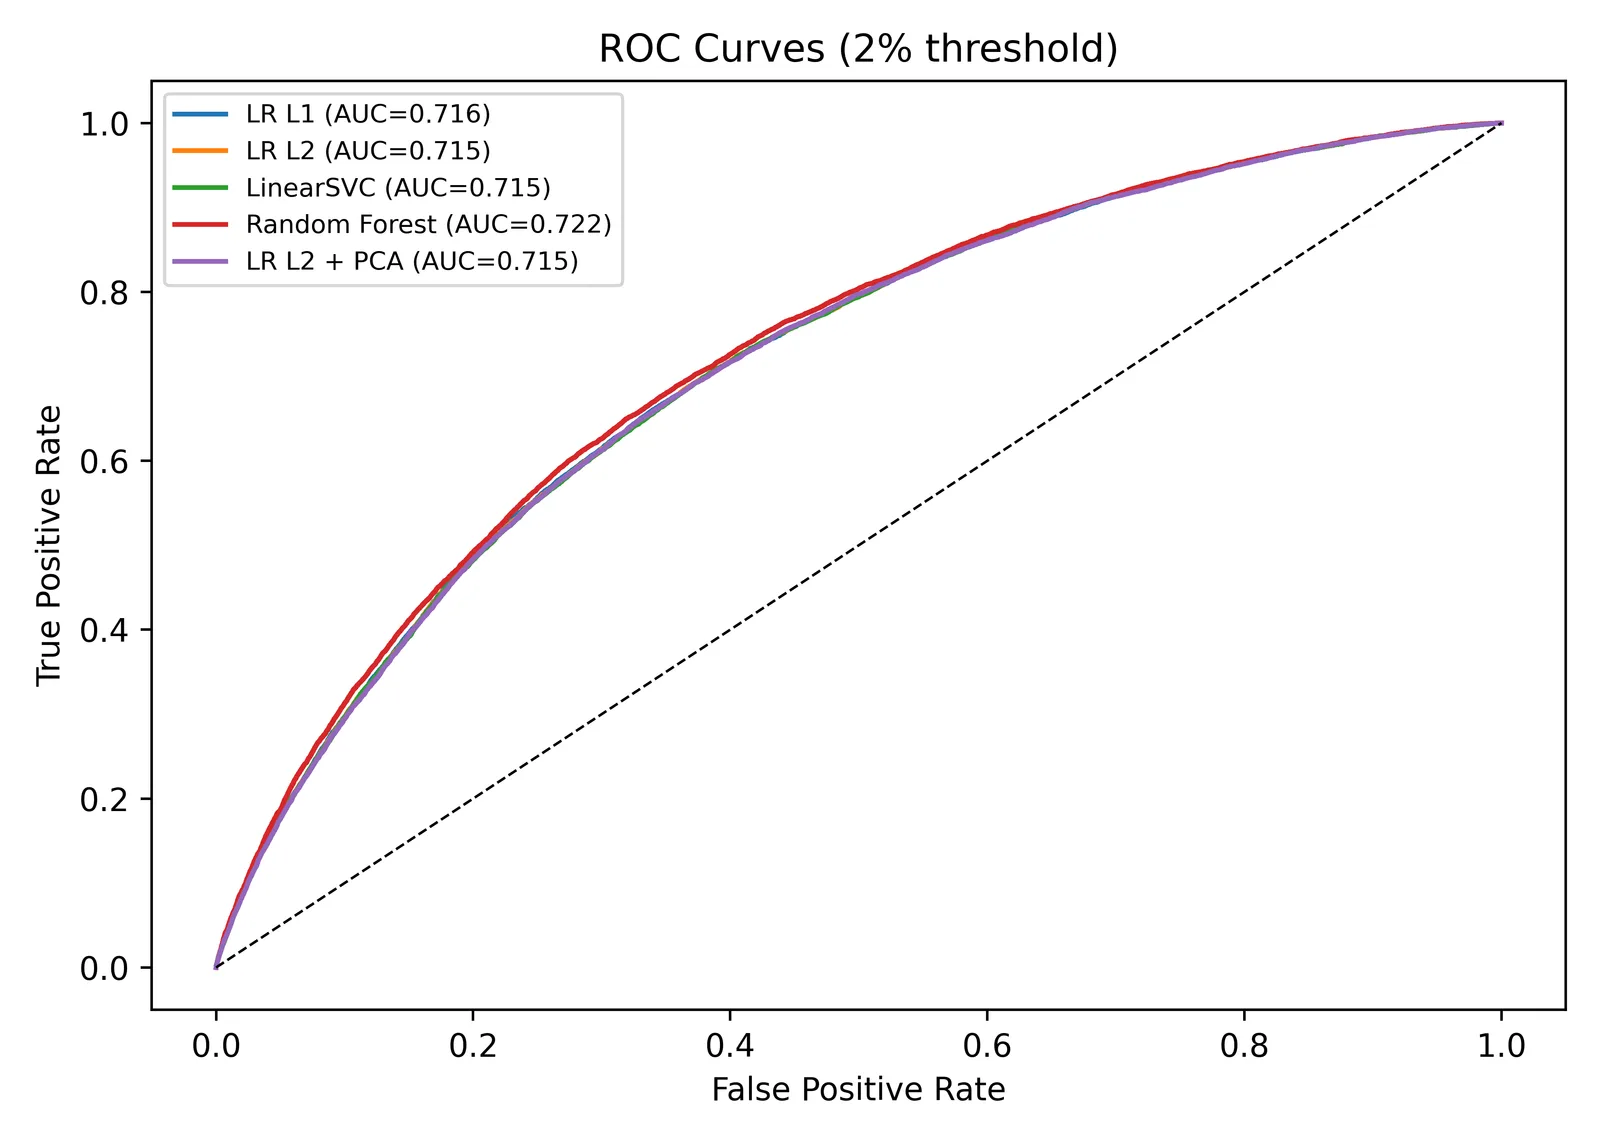
| Logistic regression, L1 | 0.303 | 0.716 | 0.226 | 0.460 |
| Logistic regression, L2 | 0.303 | 0.716 | 0.226 | 0.456 |
| Linear SVM | 0.300 | 0.715 | 0.229 | 0.435 |
| Random Forest | 0.307 | 0.723 | 0.221 | 0.502 |
| Logistic regression, L2 + PCA | 0.301 | 0.715 | 0.226 | 0.451 |
What I found
- Random Forest was best at both thresholds, which suggests nonlinear feature interactions matter.
- L1 and L2 regularization gave nearly identical results. L1 zeroed 2 of the 12 features without hurting performance, so those carried little independent signal.
- PCA at 95% variance cut 12 features to 9 components and slightly hurt performance: the dropped components held a small amount of real signal.
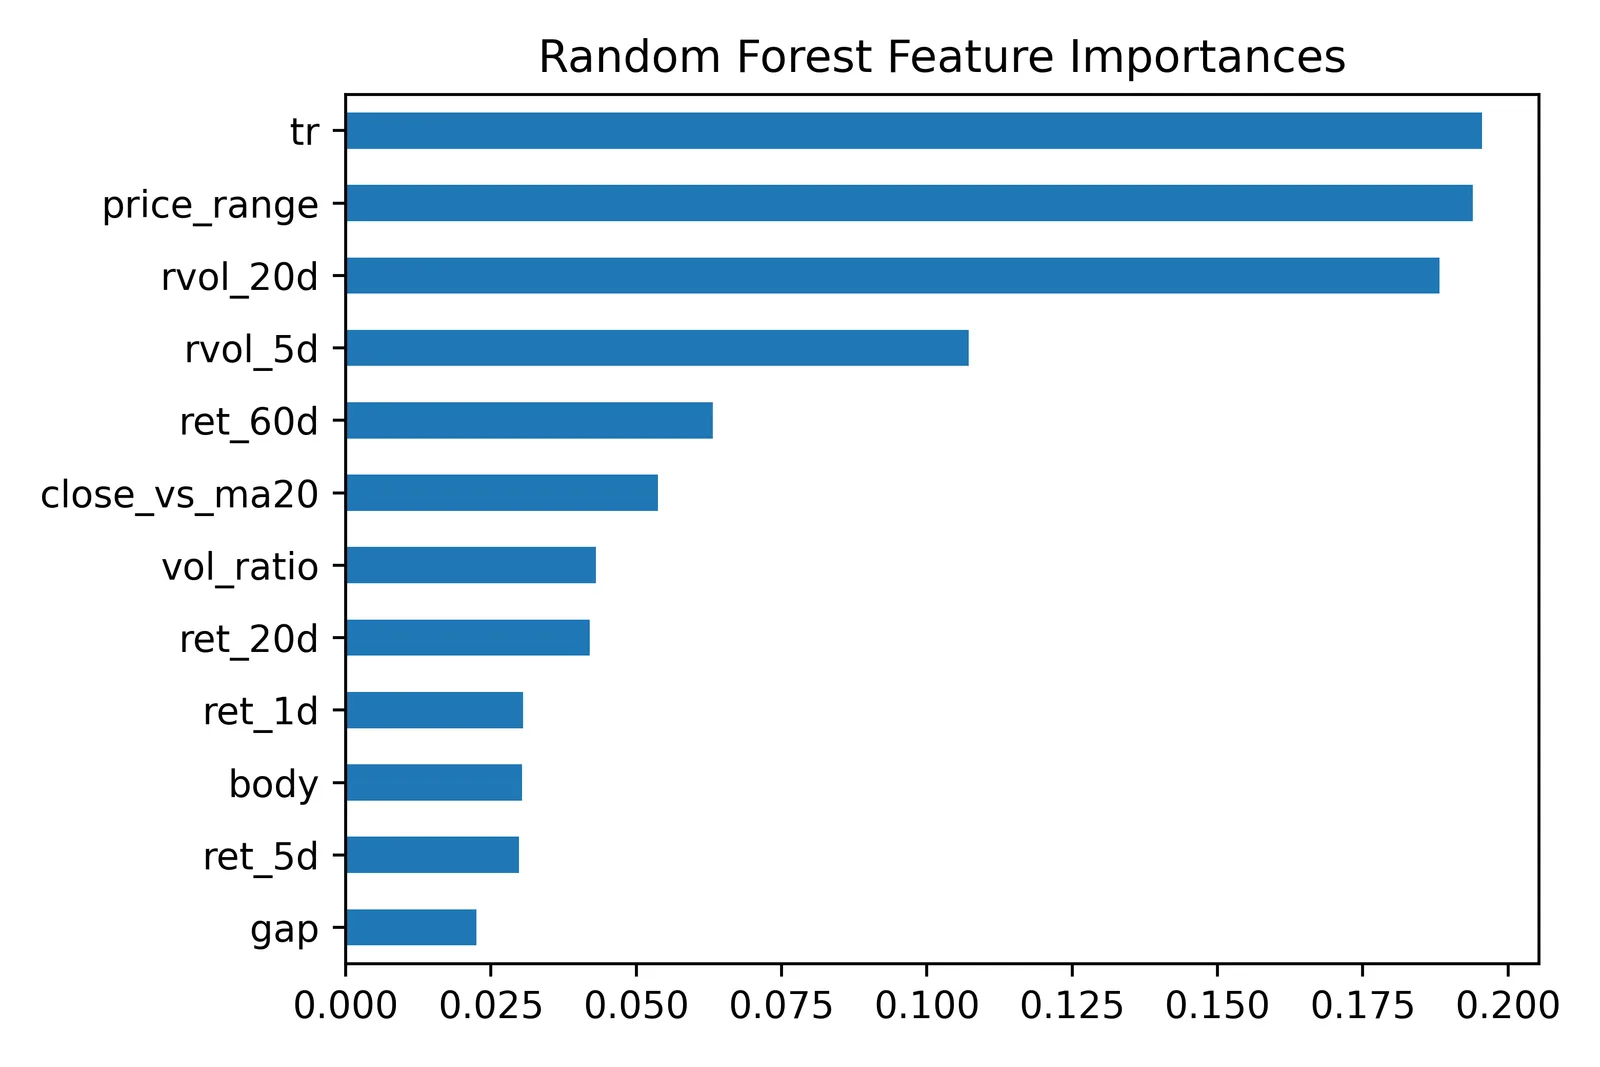
- Volatility and price-range features were consistently the strongest predictors.
Limitations
- Validation F1 was higher than test F1 for every model. The test year (2017) was a calmer market than the validation year (2016), which is a real cost of a time-based split.
- All stochastic steps use a fixed random seed, so the numbers above reproduce from the repo.
Figures
Built with
PythonPandasNumPyScikit-learnTime-Series ValidationFeature Engineering